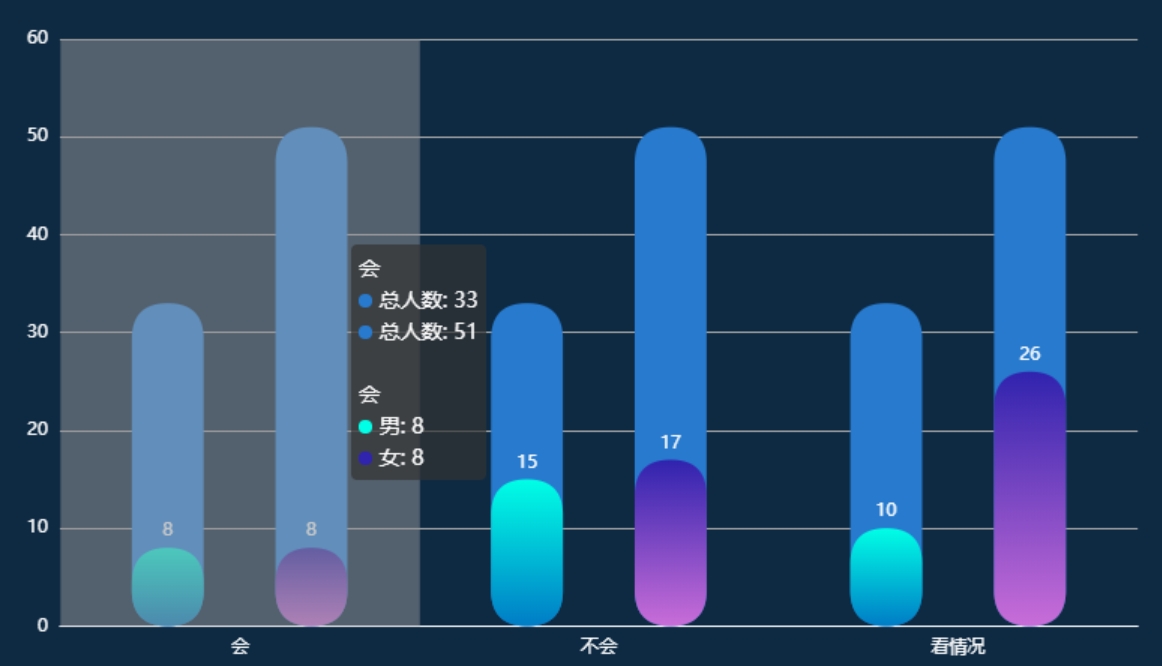
要使用 Highcharts 创建一个交互式的堆叠柱形图,你需要遵循以下步骤:

-
准备数据:确保你有适当格式的数据,每个数据点应该包含 x 值和 y 值,以及可能的其他相关信息,如系列名称。
-
初始化 Highcharts 实例:在你的 HTML 页面中,选择一个容器元素(如 <div id="container"></div>),然后使用 Highcharts 的 chart() 函数来初始化图表。
-
配置图表选项:在 chart() 函数中,你需要指定图表的类型(在这个例子中是 'column'),以及其他必要的配置项,如标题、轴、系列等。
-
配置系列(series):在配置对象中,你需要定义至少一个系列,每个系列包含数据、名称和可能的其他选项。对于堆叠柱形图,你还需要设置 stack 属性来指定系列属于哪个堆叠。
-
添加交互功能:Highcharts 支持多种交互功能,如工具提示、点击事件等。你可以通过配置选项来启用这些功能。
-
更新图表:如果你需要在图表创建后动态更新数据或配置,可以使用 Highcharts 的 update() 方法。
以下是一个简单的 Highcharts 堆叠柱形图的示例代码:
<!DOCTYPE html>
<html lang="en">
<head>
<meta charset="UTF-8">
<title>Interactive Stacked Column Chart with Highcharts</title>
<script src="https://code.highcharts.com/highcharts.js"></script>
<script src="https://code.highcharts.com/modules/exporting.js"></script>
</head>
<body>
<div id="container" style="width:100%; height:400px;"></div>
<script>
var data = [
{
name: 'Category A',
data: [10, 20, 15]
},
{
name: 'Category B',
data: [5, 7, 8]
},
{
name: 'Category C',
data: [15, 12, 18]
}
];
$('#container').highcharts({
chart: {
type: 'column'
},
title: {
text: 'Interactive Stacked Column Chart'
},
xAxis: {
categories: ['Jan', 'Feb', 'Mar']
},
yAxis: {
min: 0,
title: {
text: 'Value'
}
},
legend: {
reversed: true
},
series: data
});
$('#container').on('click', 'rect', function () {
var point = this.point;
alert('Clicked on point ' + point.x + ' with value ' + point.y);
});
$('#container').on('mouseover', 'rect', function () {
var point = this.point;
$(this).attr('fill', 'orange');
});
$('#container').on('mouseout', 'rect', function () {
var point = this.point;
$(this).attr('fill', null);
});
</script>
</body>
</html>
在这个示例中,我们首先定义了一个数据数组,其中包含三个系列的数据。然后,我们使用 Highcharts 的 chart() 函数初始化图表,并设置了必要的配置选项。我们还配置了点击和悬停事件,以便在用户与图表互动时提供反馈。
请注意,你需要确保已经在页面中包含了 Highcharts 的 JavaScript 文件,以及任何你可能需要的模块(如导出模块)。


 QQ客服专员
 电话客服专员